rhAmpSeq™ CRISPR Data Analysis System
An advanced CRISPR data analysis pipeline for quantifying your genome editing results. Expect quick and accurate quantification of CRISPR-Cas edits. Our proprietary RNAse H2-dependent PCR technology generates amplicon libraries for targeted sequencing on Illumina® NGS platforms. The system includes an advanced, yet accessible, cloud-based CRISPR data analysis pipeline for quantification of on- and off-target edits.
Alt-R™ CRISPR — Complete workflow from design to analysis.
Overview
The rhAmpSeq CRISPR Data Analysis System allows quick and accurate quantification of CRISPR-Cas edits. Our proprietary RNase H2-dependent PCR technology generates amplicon libraries for targeted sequencing on Illumina® NGS platforms. The system also includes an advanced but accessible cloud-based data analysis pipeline for quantification of on- and off-target edits.
- Best-in-class insertion/deletion (indel) quantification of genome editing
- Batch analysis of your results (multiplex up to 500 targets)
- High sequencing coverage uniformity and percentage of mapped reads
- Intuitive CRISPR data analysis that requires no bioinformatics expertise
- Sample-to-analysis in under a week
Harnessing the power of rhAmp™ PCR for characterizing on- and off-target editing
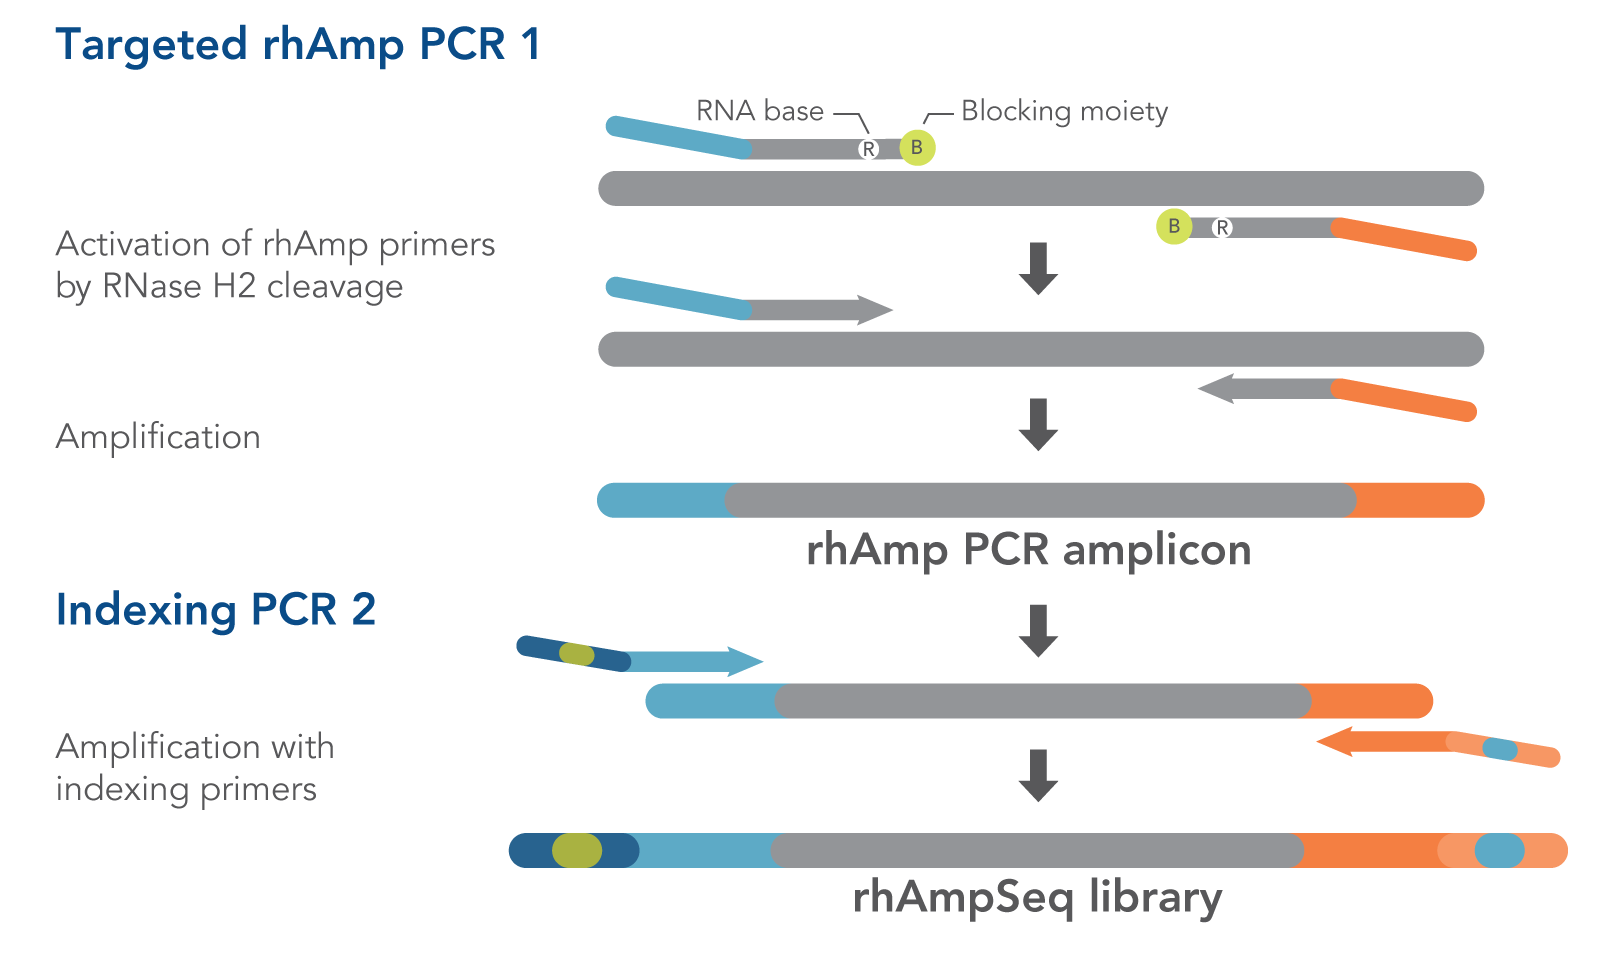
The rhAmpSeq CRISPR Data Analysis System depends on our proprietary rhAmp PCR technology . Using RNA-base–containing blocked primers (rhAmp primers), this technology harnesses the intrinsic specificity of the RNase H2 enzyme to cleave DNA:RNA duplexes. Due to its inherent mitigation of primer dimers, rhAmp PCR exhibits high specificity, even in multiplex reactions. The rhAmpSeq system combines this innate advantage with a convenient workflow that requires only two PCR steps (Figure 1) to generate amplicon libraries for Illumina sequencing platforms. Figure 1 shows both amplification steps in the rhAmpSeq workflow, highlighting the role of rhAmp PCR technology during the first step (Targeted rhAmp PCR 1). Coupled with our industry-leading oligo manufacturing process, the rhAmpSeq system offers fast and cost-effective data analysis of your CRISPR results.
Figure 1. Amplification steps in the rhAmpSeq workflow. RNase H2 activates rhAmp primers by target-specific cleavage of the RNA base within the DNA:RNA duplex, removing a 3′ blocker. RNase H2 activity is highly specific, thus reducing the amount of amplification from non-specific hybridization and primer dimers. Only activated rhAmp primers can be extended to generate target amplicons.
Illumina sample indexes and P5/P7 sequences are incorporated during the second amplification step.
Workflow for analyzing your CRISPR-Cas editing results
The rhAmpSeq CRISPR Analysis System offers a convenient workflow that takes you from sample to results in under a week.
Before you begin:
Identify and nominate both on- and off target sequences. The rhAmpSeq Analysis System workflow begins after the identification of potential targets. Off-target sites can be nominated using empirical methods such as GUIDE-Seq with or without in silico prediction tools.
Design and order your panel
rhAmpSeq CRISPR Panel to order your design
Prepare your amplicon library
Sequence
Sequence your library on an Illumina® platform
Analyze
Product data
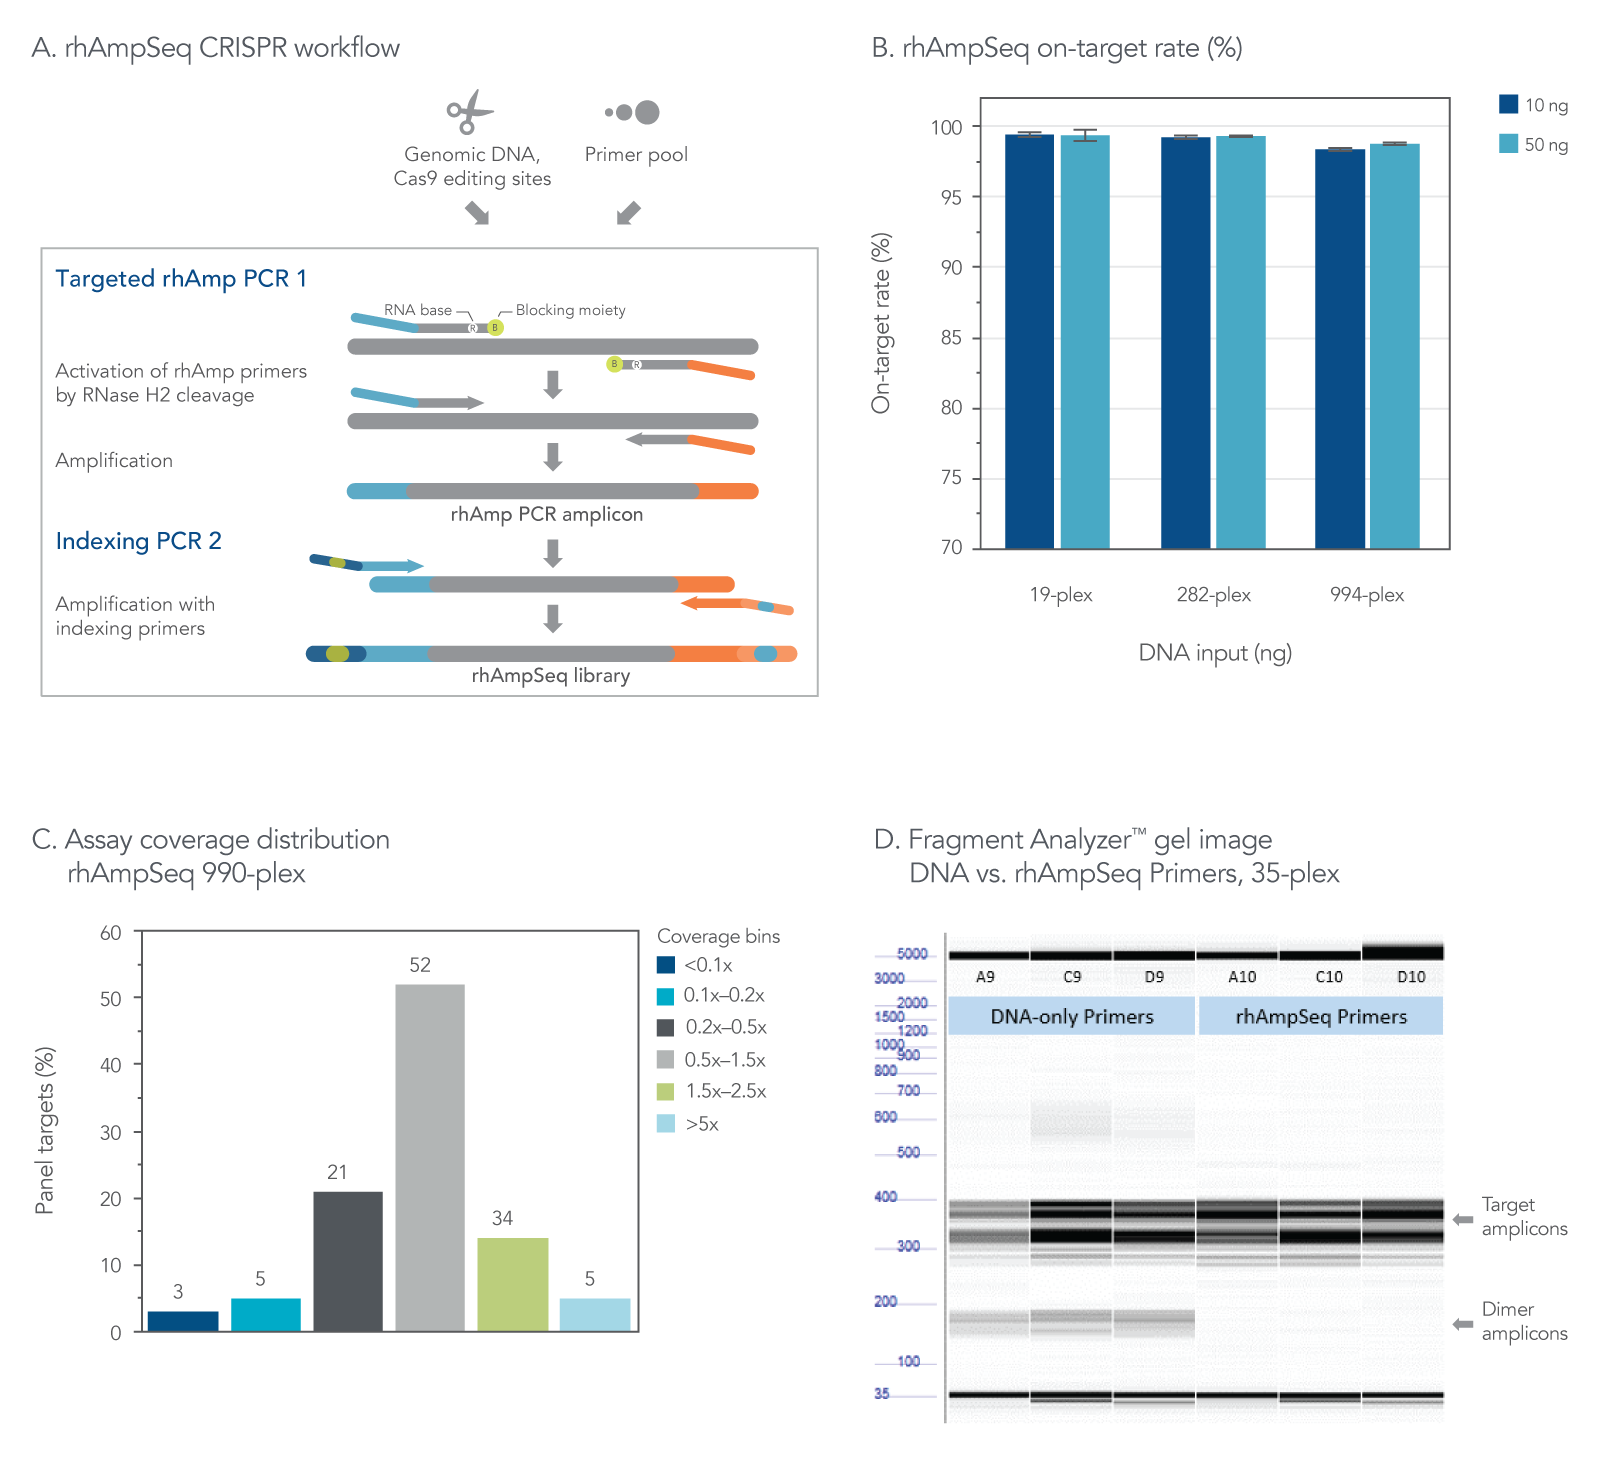
The rhAmpSeq CRISPR Analysis System enables singleplex or multiplex analysis of CRISPR edits by next generation sequencing (NGS) in less than a week. Our custom design tool supports maximal compatibility between the target primers. The rhAmpSeq CRISPR Library Kit prevents primer-dimer amplification during the few simple PCR steps required before sequencing on any Illumina® instrument (Figure 2). The system provides access to an intuitive data analysis tool that generates publication-quality figures without the need for advanced bioinformatics expertise.
Figure 2. The rhAmpSeq CRISPR Analysis System provides on-target rate and uniform coverage with minimized primer-dimer amplicons. (A) The workflow for targeted enrichment via amplification with the rhAmpSeq CRISPR Analysis System generates NGS-ready libraries in two straightforward PCR steps. (B) The rhAmpSeq CRISPR on-target rate represents the fraction of reads from expected targets in the rhAmpSeq CRISPR Panel relative to all mapped reads from the library. In this experiment, genomic DNA samples (Coriell) were amplified with a 19-, 282-, and 994-plex rhAmpSeq CRISPR Panel with 10 and 50 ng of input DNA. All panels were highly specific giving on-target mapping rates of >98% (n = 3 amplifications per condition). (C) The uniformity of target amplification in a 990-plex, as shown. In this experiment, 95% of all targets give coverage that is >0.2X of the mean coverage depth of the entire panel (n = 1). (D) DNA-only primers compared to rhAmp primers show an accumulation of primer dimers in this 35-plex reaction with unblocked DNA primers, while no primer-dimers are observed when using end-blocked, RNaseH2-cleavable, rhAmp primers.
Panel uniformity
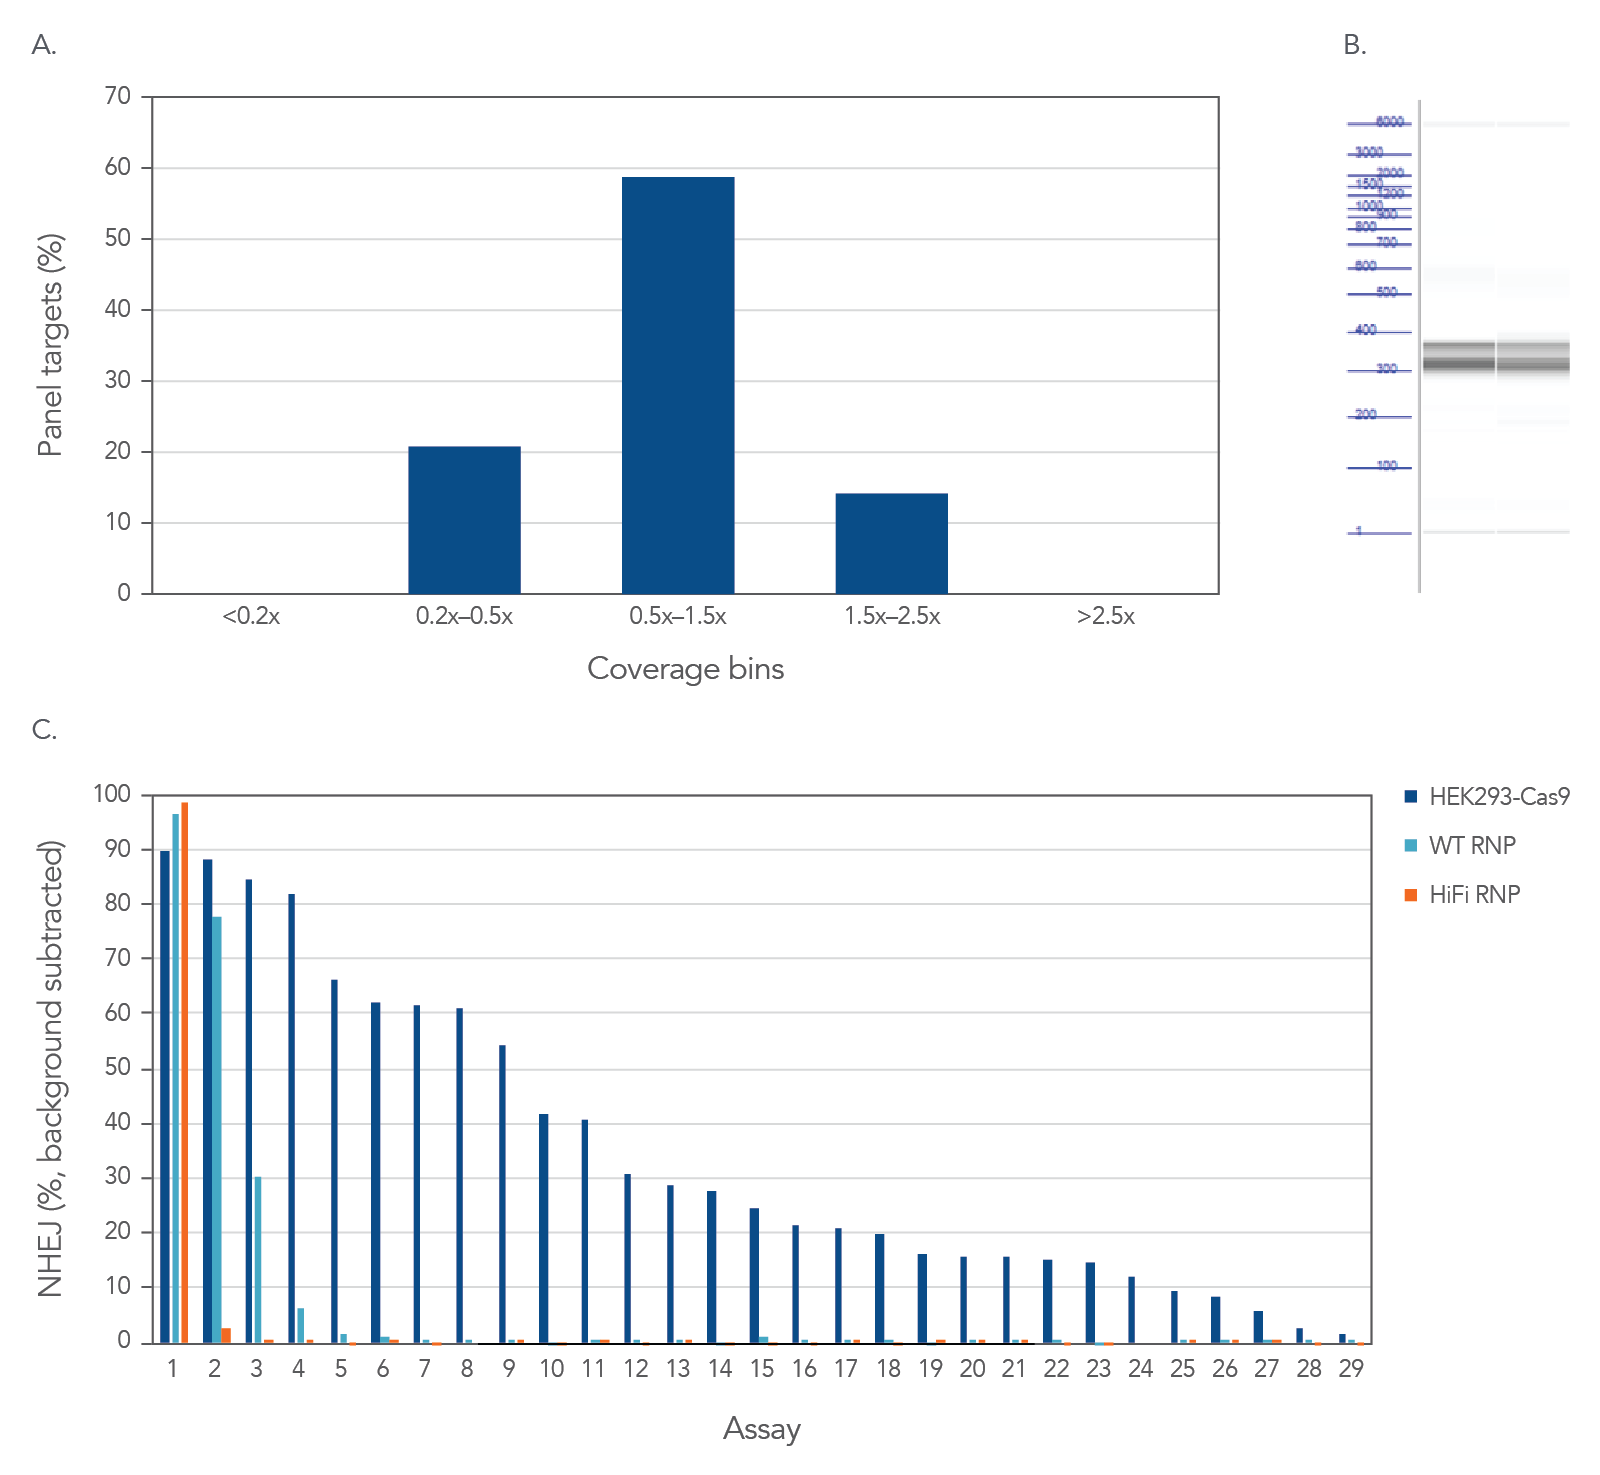
Consistent uniformity and selectivity with rhAmpSeq CRISPR Panels allow for interrogation of on- and off-target editing in a single library prep with PCR amplification, as represented below using the popular AAVS1 “safe harbor” site (Figure 3). All 28 empirically-identified off-target sites can be verified when Cas9 is constitutively expressed in HEK293 cells. Using ribonucleoprotein (RNP) delivery of the Cas9/guide complex together with Alt-R™ S.p. HiFi Cas9 Nuclease V3 dramatically reduces off-target editing.
Figure 3. High uniformity and selectivity with rhAmpSeq CRISPR Panels allow for interrogation of on- and off-target editing in a single library prep with PCR amplification. HEK293 cells constitutively expressing S.p. Cas9 nuclease were electroporated with 10 µM AAVS1-targeting Alt-R sgRNA. Alternatively, standard HEK293 cells were electroporated with 4 µM Alt-R wild-type (WT) or HiFi Cas9 Nuclease complexed to the AAVS1 sgRNA (at a 1:1.2 protein to gRNA ratio), including 4 µM Alt-R Cas9 Electroporation Enhancer using the Amaxa™ Nucleofector™ 96-well Shuttle™ System (Lonza) (n = 1 transfection per condition). gDNA was isolated and amplified using a custom rhAmpSeq CRISPR Panel containing amplicons for the on-target, and 28 of the top off-target sites identified by GUIDE-Seq. Amplicon sequencing on the Illumina MiSeq (v2 chemistry, 150 bp paired-end reads) was performed and analyzed using the rhAmpSeq CRISPR Analysis Tool. (A) The histogram of panel coverage shows 100% of assays have read coverage depth that is >0.2X of the mean read coverage depth, indicating highly uniform enrichment via amplification. (B) Fragment analysis of final panels in duplicate shows the expected fragment sizes of 300–400 bp with no primer dimers present. (C) NHEJ editing for the on-target locus (Assay 1) and off-target loci (Assays 2-29) is reported using an untreated control for background subtraction. Background editing was <0.2% for all assays in this panel.
High accuracy
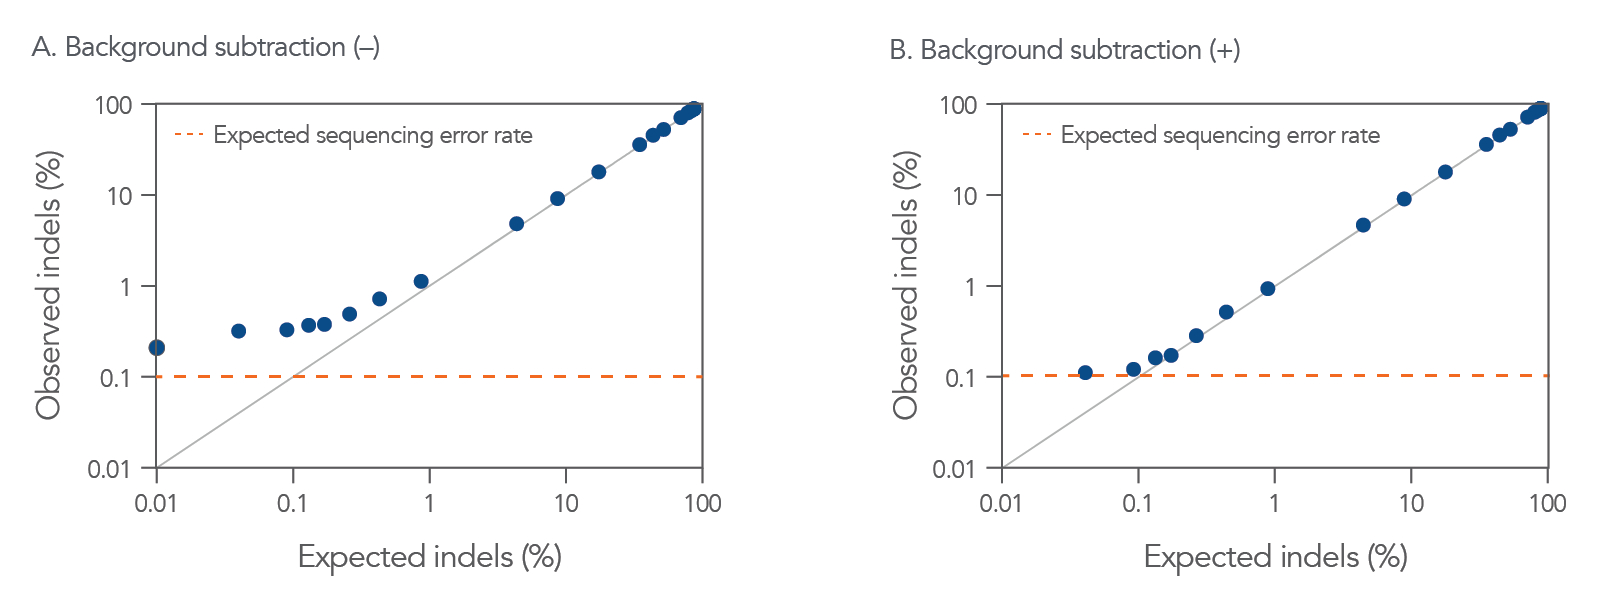
The rhAmpSeq CRISPR Analysis System offers access to the rhAmpSeq CRISPR Analysis Tool, which enables identification of low-frequency insertion/deletions (indels) (Figure 4).
Figure 4. CRISPAltRations identifies low levels of indel frequencies introduced by CRISPR genome editing. CRISPAltRations is the analysis platform behind the rhAmpSeq CRISPR Analysis Tool. The pipeline’s indel identification concordance with TRUTH was determined (black line representing perfect concordance) using a titrated mixture of gBlocks Gene Fragments (n = 27 mixes) with known concentrations of indels for an HPRT target (>40,000 reads per sample) sequenced with MiSeq v2 chemistry, and the relationship between the % indels expected, compared to the % indels observed is shown (A) before, and (B) after a simple background subtraction. The background correction is performed by subtracting the percent indels observed in an unmodified gBlocks control from all indel-containing samples. The expected amount of baseline sequencing error on an Illumina MiSeq instrument (orange dotted line) is shown for reference.
Accurate indel calling
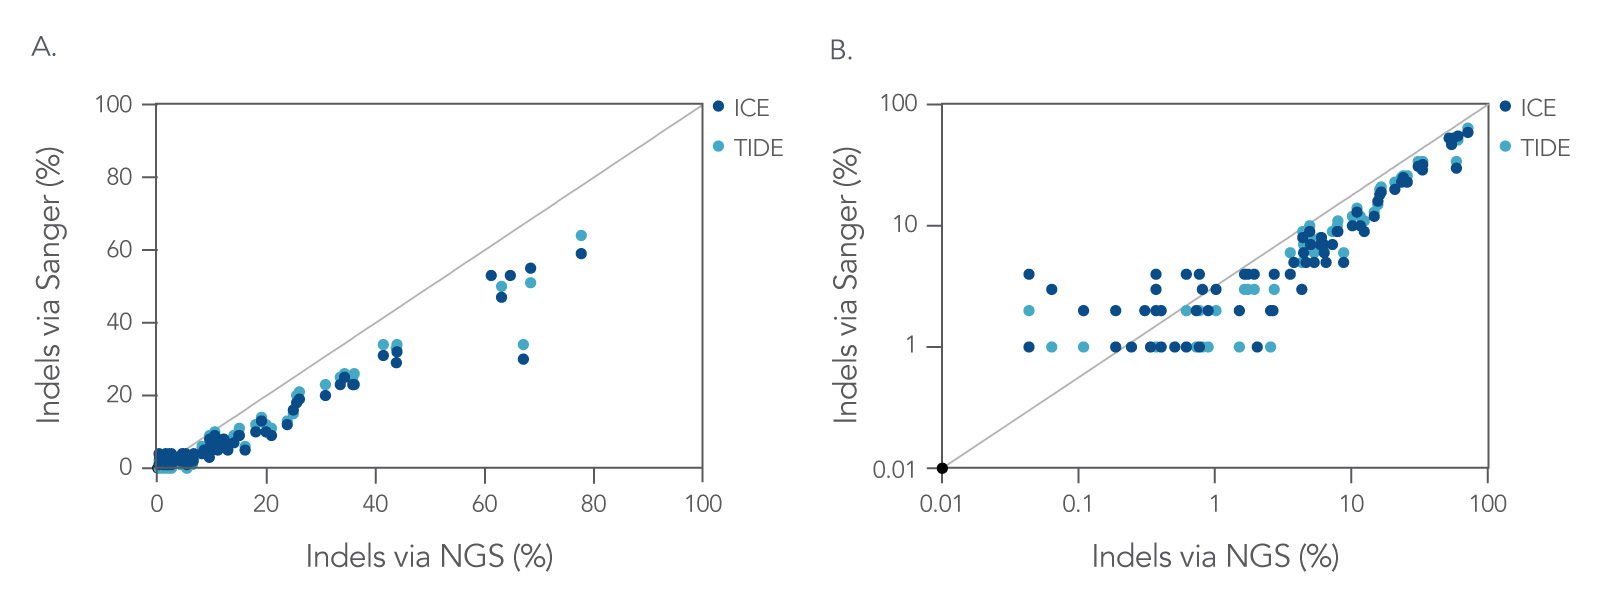
Powered by NGS, the rhAmpSeq CRISPR Data Analysis System offers more accurate annotation of genomic edits than Sanger deconvolution, particularly at low editing frequencies (Figure 5).
Figure 5. Next generation sequencing (NGS) is more accurate than Sanger deconvolution for annotating genome editing, especially at low editing frequencies. On-target editing levels for guide RNAs (gRNAs) targeting the RAG1 and RAG2 loci in CD34+ hematopoietic stem/progenitor cells (HSPCs) quantified by NGS are compared to Sanger deconvolution methods (TIDE/ICE). gRNAs were delivered in multiple formats (IVT sgRNA, 2-part system, 2-part system with XT modifications, and synthetic sgRNA) and multiple RNP concentrations (1 µM, 2 µM, 4 µM) for each gRNA in triplicate (n = 72 samples per analysis method). The comparisons of editing frequencies are shown in (A) linear, and (B) log scale. Sanger deconvolution methods generally underestimate editing frequency and are unreliable at editing frequencies <10%. (Results adapted from Shapiro et al. 2020.)
Batch analysis of single amplicon assays
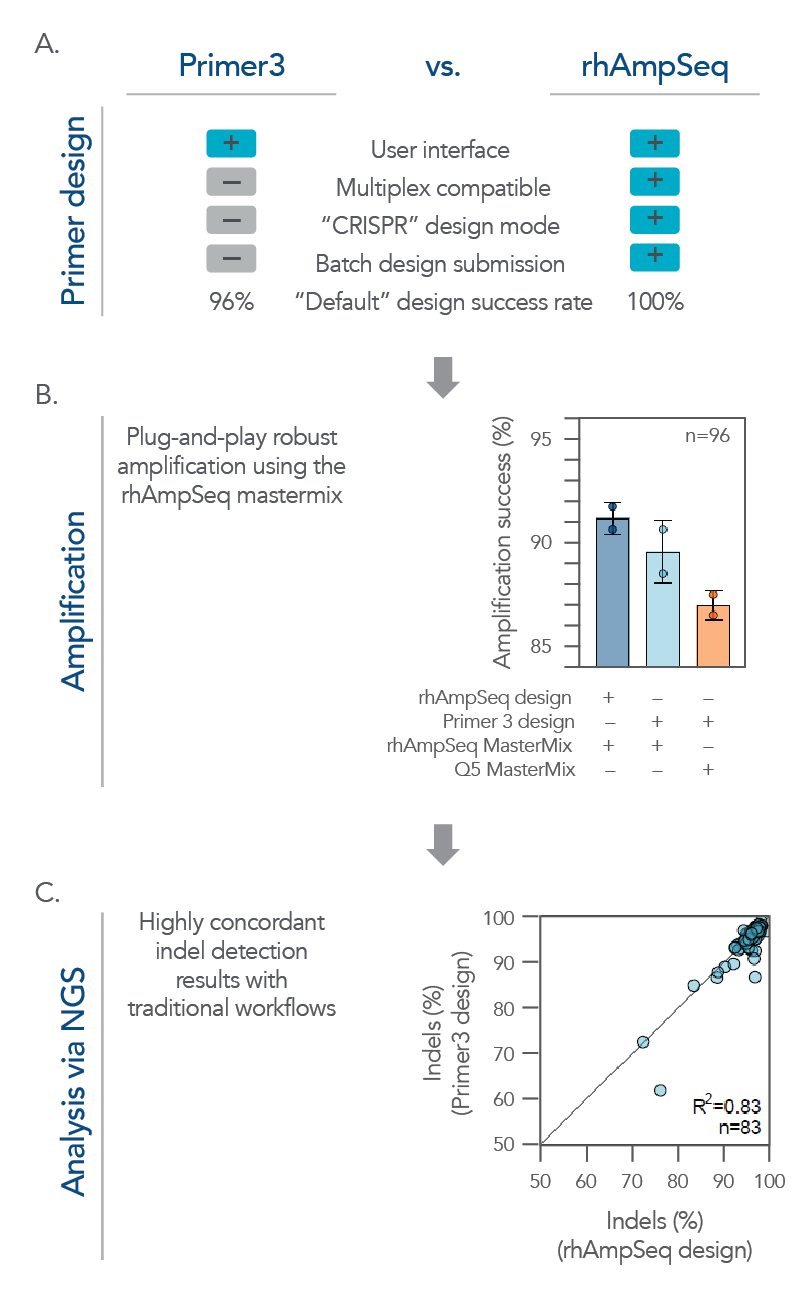
While the rhAmpSeq CRISPR Analysis System is designed for multiplex analysis of on- and off-target editing, it also expertly handles batch analysis for single amplicon designs. Its analyses of on-target editing have high concordance with traditional workflows, but with a simplified workflow, supporting high-throughput discovery applications (Figure 6).
Figure 6. The rhAmpSeq CRISPR System supports a complete workflow for high-throughput, batch single amplicon design and analysis for on-target editing. (A) A batch of single amplicon assays (n = 96) were designed using the rhAmpSeq Design Tool or Primer3 (primers spaced >20 bp from the cut site with 130 bp design space) with default parameters, and the features/design success rates were compared. The rhAmpSeq Design Tool was more supportive than Primer3 to batch primer design. (B) Primers designed by Primer3 were synthesized as DNA-only primers, while primers designed by the rhAmpSeq Design Tool were synthesized as end-blocked, RNaseH2-cleavable rhAmp primers. DNA-only or rhAmp primers were used to amplify CRISPR-edited gDNA samples from HEK293 cells using either Q5® Hot Start High-Fidelity 2x Master Mix (NEB) or rhAmpSeq Master Mix. (C) NGS libraries from each combination of design/amplification were prepared and sequenced on an Illumina MiSeq system (2 x 150) and analyzed using the rhAmpSeq CRISPR Analysis Tool. Editing (% indels) concordance demonstrates that editing quantification between the two assay design strategies is equivalent.
Enabling high-throughput CRISPR data analysis and sample comparison
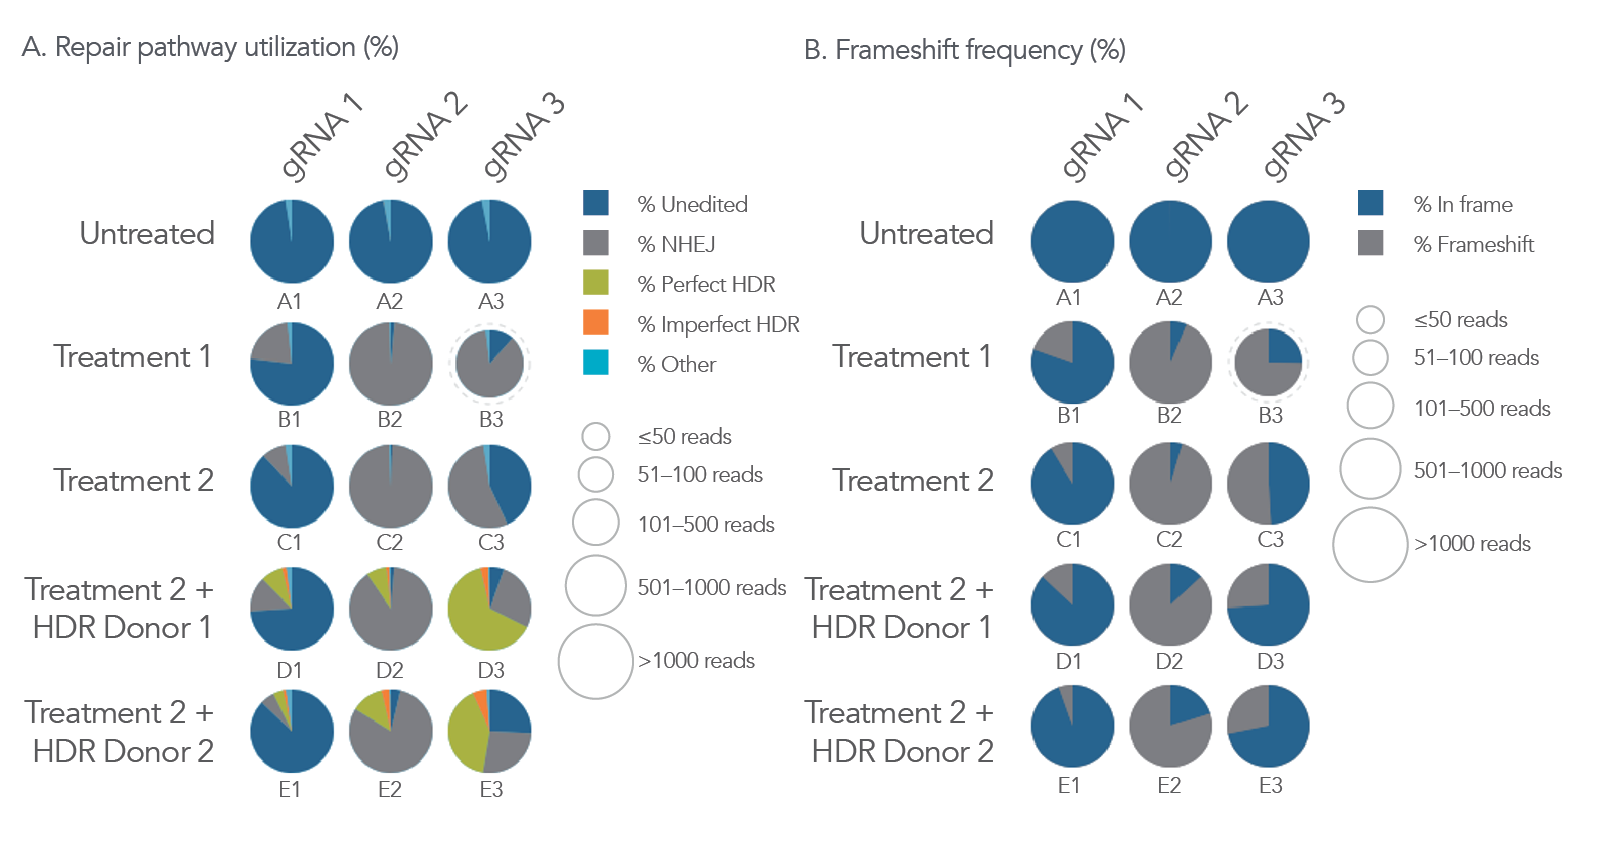
One of the many intuitive features of the rhAmpSeq CRISPR Data Analysis System is the ability to display editing outcomes simultaneously on a single display (from up to 384 samples) allowing easy comparison between multiple experimental parameters (Figure 7).
Figure 7. Intuitive analysis of multiple CRISPR editing conditions using the rhAmpSeq CRISPR Data Analysis Tool. Three different guide RNAs (gRNA) were screened via nucleofection into HAP1 cells under two different treatment conditions while incorporating two different homology-directed repair (HDR) templates (3 x 5 experiment design). gDNA was isolated after 72 hours, and NGS libraries were then prepared using the rhAmpSeq CRISPR protocol, sequenced on an Illumina MiSeq system (2 x 150), and analyzed to calculate editing using the rhAmpSeq CRISPR Data Analysis Tool. The rhAmpSeq CRISPR Analysis Tool generates frequencies of (A) editing via various DNA repair pathways as well as (B) total frameshift on a per well basis (with display for up to 384 wells). Additionally, read depth information is displayed with variable-sized pie charts. In this example data set, well D3 is an optimal condition for generating a clone with the anticipated editing event, as it has the highest level of perfect HDR occurring with a low level of concomitant, frameshift-causing mutations.
Accurate data analysis
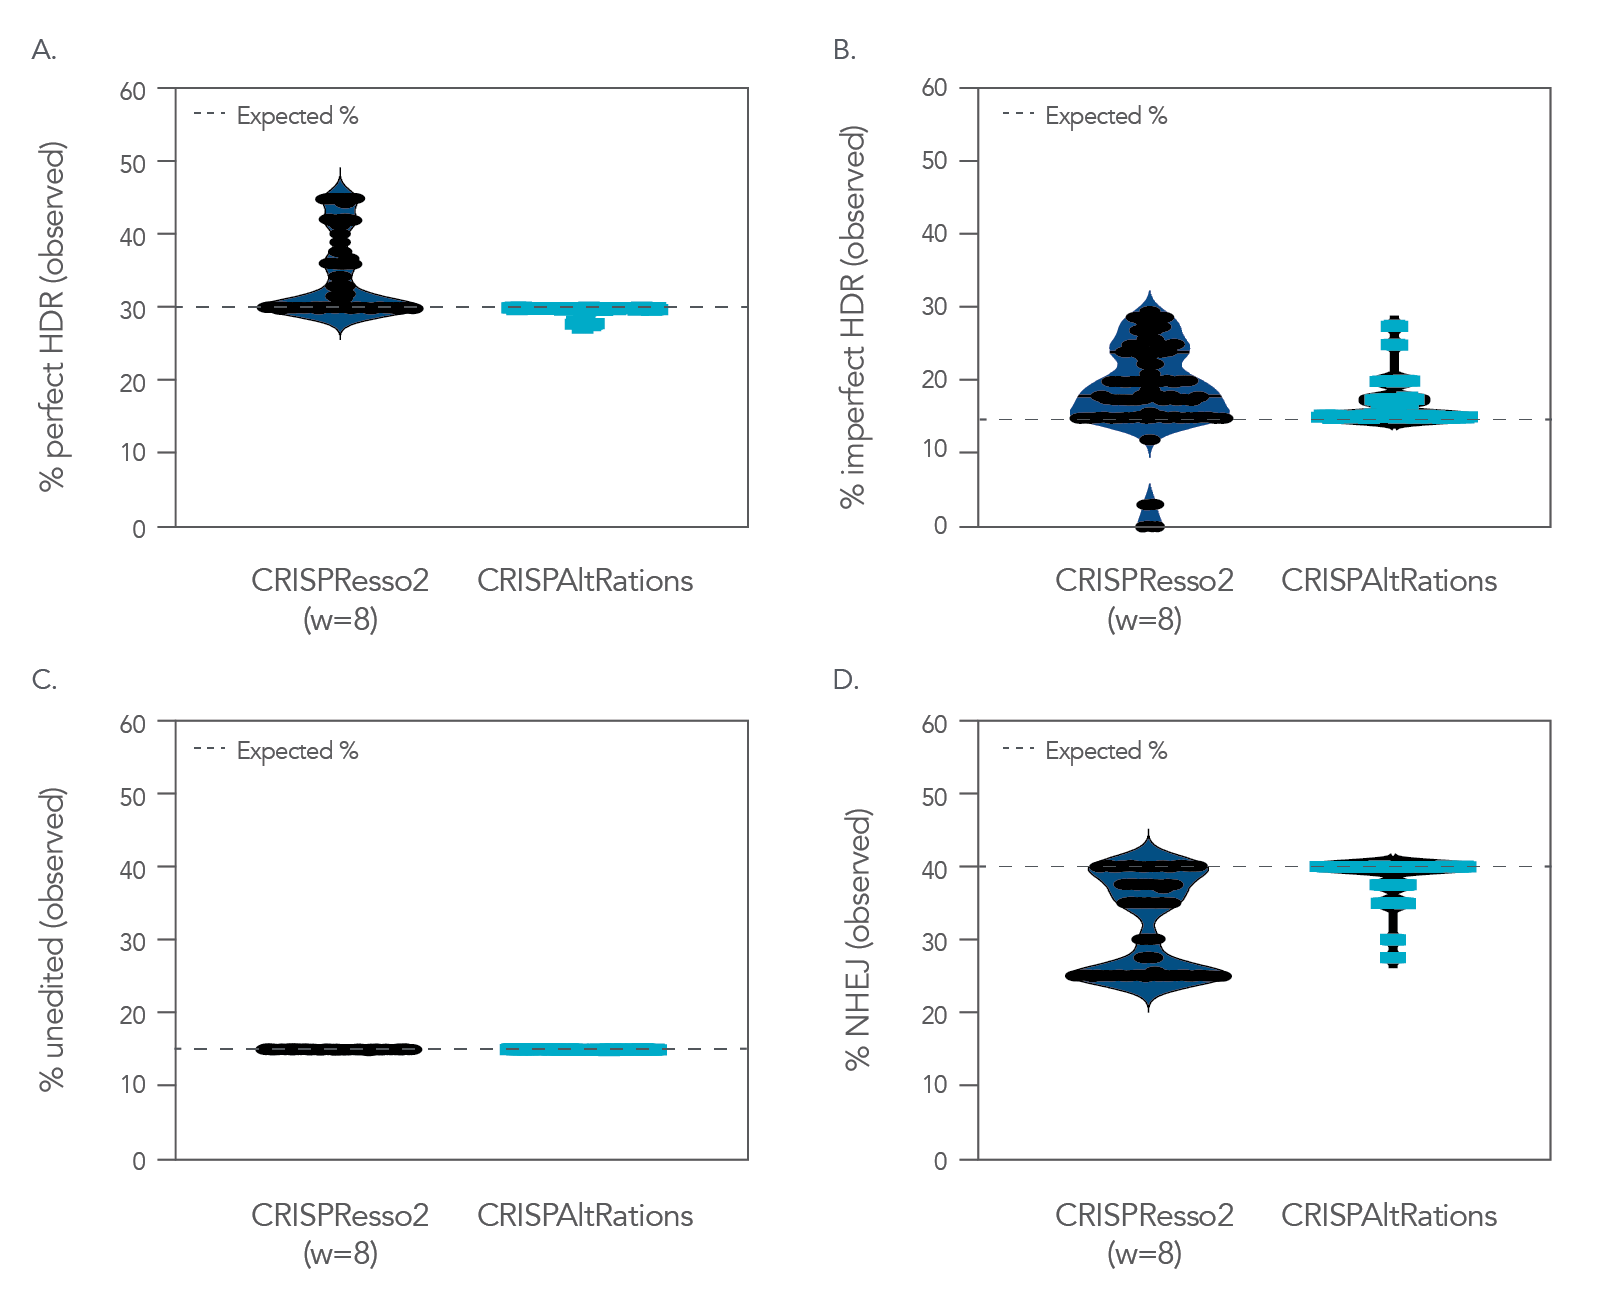
Because genome editing outcomes are challenging to analyze, it is imperative that a trustworthy data analysis tool is used. When challenged with a dataset containing predetermined editing events, the rhAmpSeq CRISPR Data Analysis System consistently generates more accurate analyses than some alternative systems (Figure 8).
Figure 8. CRISPAltRations demonstrates superior accuracy for annotating HDR events derived from CRISPR genome editing. CRISPAltRations is the analysis platform behind the rhAmpSeq CRISPR Data Analysis Tool. CRISPResso2 and CRISPAltRations were compared using a synthetic dataset (n = 91 sites) for their ability to accurately determine the percentage of events derived from (A) perfect HDR, (B) imperfect HDR (HDR event with any unintended mutations), (C) wild type, and (D) NHEJ at all edited sites (w=window size).
